安装 graphviz
参考文档 http://graphviz.readthedocs.io/en/stable/manual.html#installation
graphviz安装包下载地址 https://www.graphviz.org/download/
将graphviz的安装位置添加到系统环境变量
使用pip install graphviz安装graphviz python包
使用pip install pydotplus安装pydotplus python包
决策树模型可视化
以iris数据为例。训练一个分类决策树,调用export_graphviz函数导出DOT格式的文件。并用pydotplus包绘制图片。
#在环境变量中加入安装的Graphviz路径

import os
os.environ["PATH"] += os.pathsep + 'E:/Program Files (x86)/Graphviz2.38/bin'

from sklearn import tree
from sklearn.datasets import load_iris

iris = load_iris()
clf = tree.DecisionTreeClassifier()
clf = clf.fit(iris.data, iris.target)

import pydotplus
from IPython.display import Image
dot_data = tree.export_graphviz(clf, out_file=None,
                         feature_names=iris.feature_names,
                         class_names=iris.target_names,
                         filled=True, rounded=True, special_characters=True)
graph = pydotplus.graph_from_dot_data(dot_data)
Image(graph.create_png())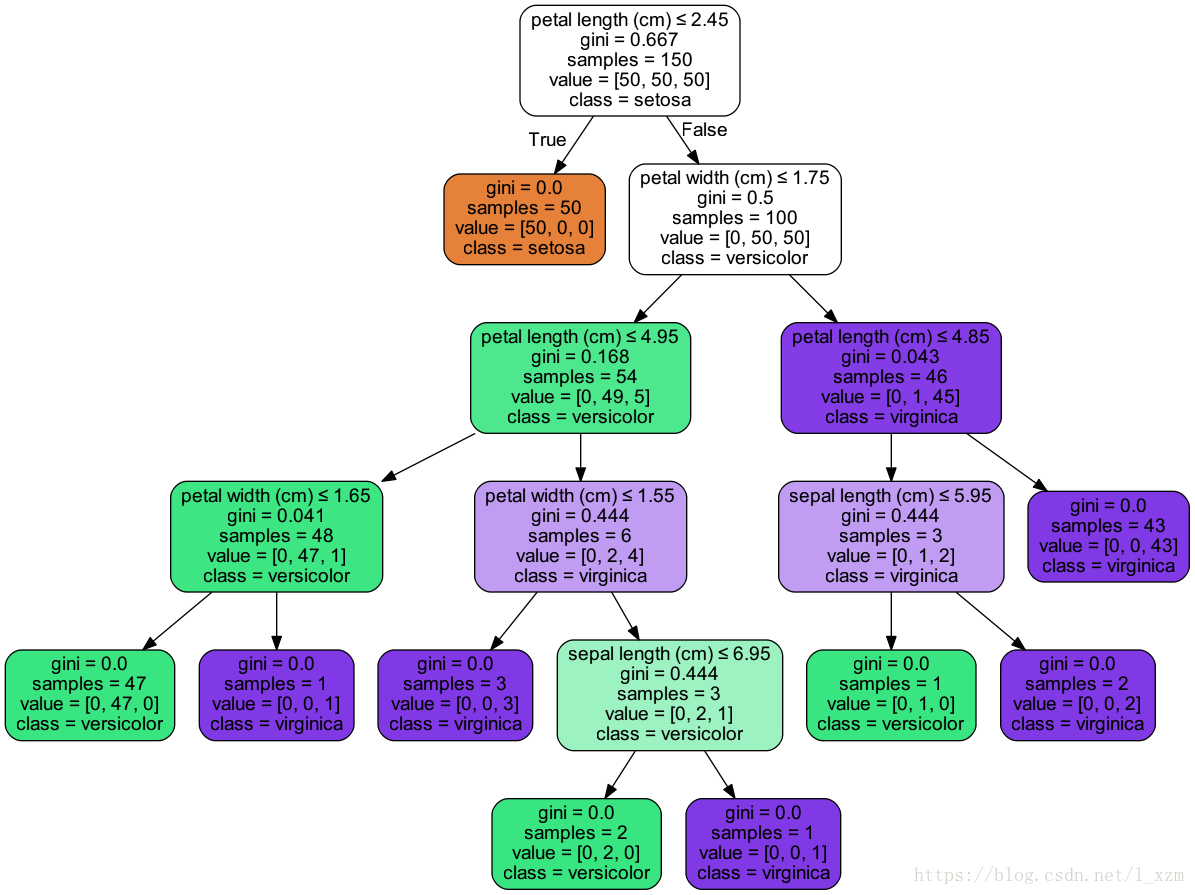
XGBoost模型可视化
参考文档 https://xgboost.readthedocs.io/en/latest/python/python_api.html
xgboost中,对应的可视化函数是xgboost.to_graphviz。以iris数据为例,训练一个xgb分类模型并可视化
# 在环境变量中加入安装的Graphviz路径

import os
os.environ["PATH"] += os.pathsep + 'E:/Program Files (x86)/Graphviz2.38/bin'

import xgboost as xgb
from sklearn.datasets import load_iris
iris = load_iris()

xgb_clf = xgb.XGBClassifier()
xgb_clf.fit(iris.data, iris.target)
xgb.to_graphviz(xgb_clf, num_trees=1)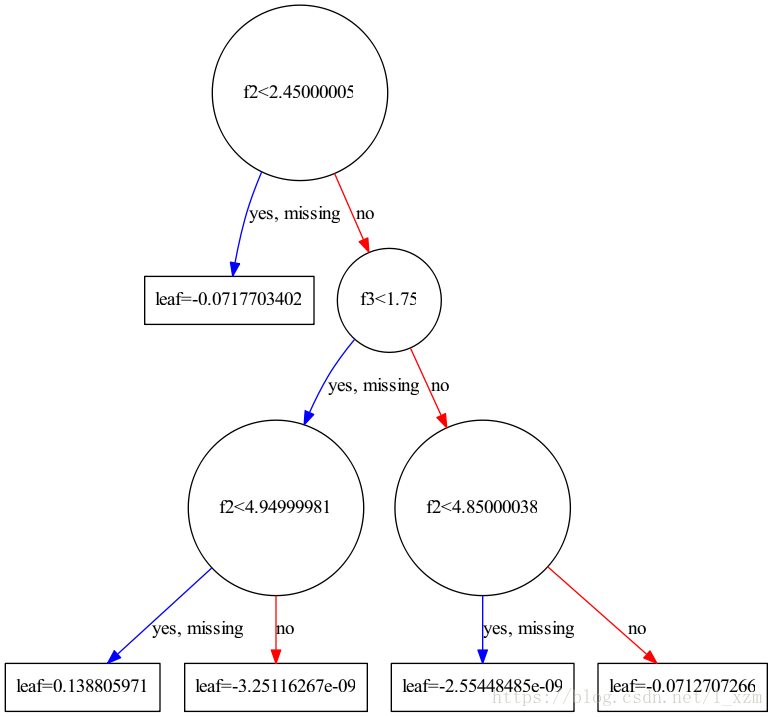
也可以通过Digraph对象可以将保存文件并查看
digraph = xgb.to_graphviz(xgb_clf, num_trees=1)
digraph.format = 'png'
digraph.view('./iris_xgb')
xgboost中提供了另一个api plot_tree,使用matplotlib可视化树模型。效果上没有graphviz清楚。
import matplotlib.pyplot as plt
fig = plt.figure(figsize=(10, 10))
ax = fig.subplots()
xgb.plot_tree(xgb_clf, num_trees=1, ax=ax)
plt.show()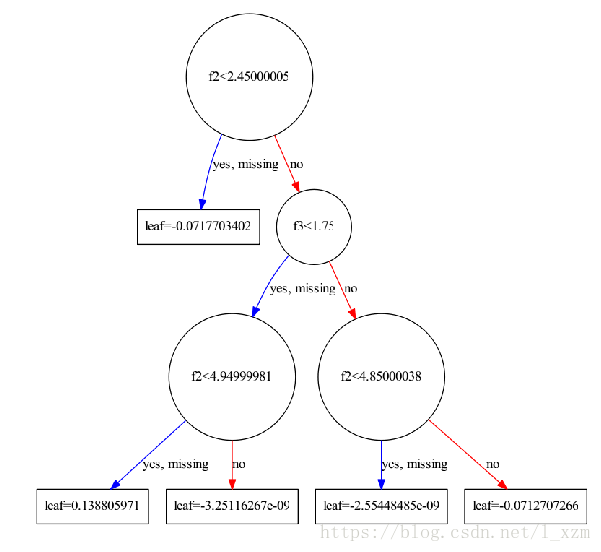
LightGBM模型可视化
参考文档 https://lightgbm.readthedocs.io/en/latest/Python-API.html#plotting
lgb中,对应的可视化函数是lightgbm.create_tree_digraph。以iris数据为例,训练一个lgb分类模型并可视化
# 在环境变量中加入安装的Graphviz路径

import os
os.environ["PATH"] += os.pathsep + 'E:/Program Files (x86)/Graphviz2.38/bin'

from sklearn.datasets import load_iris
import lightgbm as lgb

iris = load_iris()
lgb_clf = lgb.LGBMClassifier()
lgb_clf.fit(iris.data, iris.target)
lgb.create_tree_digraph(lgb_clf, tree_index=1)
lgb中提供了另一个api plot_tree,使用matplotlib可视化树模型。效果上没有graphviz清楚。
import matplotlib.pyplot as plt
fig2 = plt.figure(figsize=(20, 20))
ax = fig2.subplots()
lgb.plot_tree(lgb_clf, tree_index=1, ax=ax)
plt.show()
CatBoost模型可视化
参考文档
catboost并没有提供模型可视化的api。唯一可以导出模型结构的api是save_model(fname, format=”cbm”, export_parameters=None)
以iris数据为例,训练一个catboost模型。
参考文档 https://tech.yandex.com/catboost/doc/dg/concepts/python-reference_catboostclassifier-docpage/
catboost并没有提供模型可视化的api。唯一可以导出模型结构的api是save_model(fname, format=”cbm”, export_parameters=None)
以iris数据为例,训练一个catboost模型。
from sklearn.datasets import load_iris
from catboost import CatBoostClassifier

iris = load_iris()
cat_clf = CatBoostClassifier(iterations=100)
cat_clf.fit(iris.data, iris.target)
以python代码格式保存模型文件
cat_clf.save_model('catboost_model_file.py', format="python", export_parameters=None)也可以保存以C++代码格式保存模型文件
cat_clf.save_model('catboost_model_file.cpp', format="cpp", export_parameters=None)查看保存到的python代码,部分信息如下
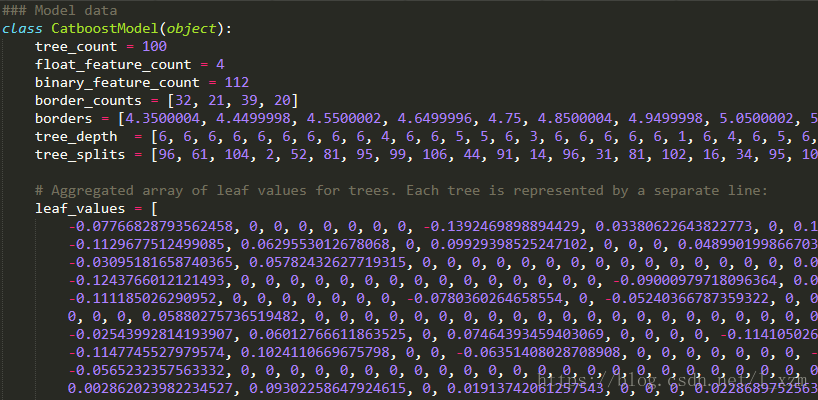
需要自己解析出文件了树的结构,再用 graphviz 绘制图像
导出的Python文件
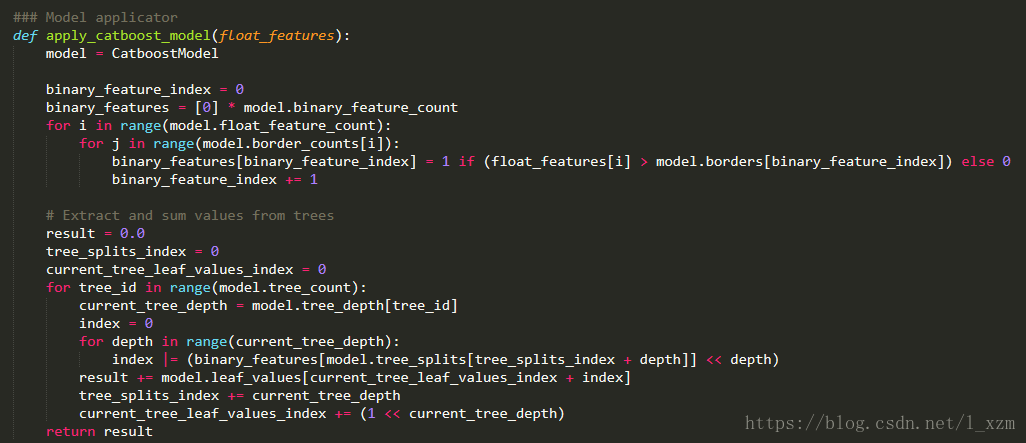
首先第一个for循环部分
binary_feature_index = 0
binary_features = [0] * model.binary_feature_count
for i in range(model.float_feature_count):
    for j in range(model.border_counts[i]):
        binary_features[binary_feature_index] = 1 if (float_features[i] > model.borders[binary_feature_index]) else 0
        binary_feature_index += 1
输入的参数float_features存储输入的数值型特征值。model.binary_feature_count表示booster中所有树的节点总数。model.border_counts存储每个feature对应的节点数量,model.borders存储所有节点的判断边界。显然,CatBoost并没有按照二叉树结构从左到右,从上到下的存储结构。此段代码的功能,生成所有节点的判断结果。如果特征值大于判断边界,表示为1,否则为0。存储在binary_features中。
第二个for循环部分
# Extract and sum values from trees

result = 0.0
tree_splits_index = 0
current_tree_leaf_values_index = 0
for tree_id in range(model.tree_count):
    current_tree_depth = model.tree_depth[tree_id]
    index = 0
    for depth in range(current_tree_depth):
        index |= (binary_features[model.tree_splits[tree_splits_index + depth]] << depth)
    result += model.leaf_values[current_tree_leaf_values_index + index]
    tree_splits_index += current_tree_depth
    current_tree_leaf_values_index += (1 << current_tree_depth)
return result
这段点代码功能是生成模型的预测结果result。model.tree_count表示决策树的数量,遍历每棵决策树。model.tree_depth存储每棵决策树的深度,取当前树的深度,存储在current_tree_depth。model.tree_splits存储决策树当前深度的节点在binary_features中的索引,每棵树有current_tree_depth个节点。看似CatBoost模型存储了都是完全二叉树,而且每一层的节点以及该节点的判断边界一致。如一棵6层的决策,可以从binary_features中得到一个长度为6,值为0和1组成的list。model.leaf_values存储所有叶子节点的值,每棵树的叶子节点有(1 << current_tree_depth)个。将之前得到的list,倒序之后,看出一个2进制表示的数index,加上current_tree_leaf_values_index后,即是值在model.leaf_values的索引。将所有树得到的值相加,得到CatBoost模型的结果。
还原CatBoost模型树
先从第二个for循环开始,打印每棵树序号,树的深度,当前树节点索引在tree_splits的便宜了,已经每个节点对应在tree_splits中的值。这个值对应的是在第一个for循环中生成的binary_features的索引。
tree_splits_index = 0
current_tree_leaf_values_index = 0
for tree_id in range(tree_count):
    current_tree_depth = tree_depth[tree_id]
    tree_splits_list = []
    for depth in range(current_tree_depth):
        tree_splits_list.append(tree_splits[tree_splits_index + depth])
    print tree_id, current_tree_depth, tree_splits_index, tree_splits_list
    tree_splits_index += current_tree_depth
    current_tree_leaf_values_index += (1 << current_tree_depth)
0 6 0 [96, 61, 104, 2, 52, 81]
1 6 6 [95, 99, 106, 44, 91, 14]
2 6 12 [96, 31, 81, 102, 16, 34]
3 6 18 [95, 105, 15, 106, 57, 111]
4 6 24 [95, 51, 30, 8, 75, 57]
5 6 30 [94, 96, 103, 104, 25, 33]
6 6 36 [60, 8, 25, 39, 15, 99]
7 6 42 [96, 27, 48, 50, 69, 111]
8 6 48 [61, 80, 71, 3, 45, 2]
9 4 54 [61, 21, 90, 37]从第一个for循环可以看出,每个feature对应的节点都在一起,且每个feature的数量保存在model.border_counts。即可生成每个feature在binary_features的索引区间。
1
2
3
4
5
6
7
8
9
10
从第一个for循环可以看出,每个feature对应的节点都在一起,且每个feature的数量保存在model.border_counts。即可生成每个feature在binary_features的索引区间。
split_list = [0]
for i in range(len(border_counts)):
    split_list.append(split_list[-1] + border_counts[i])

print border_counts
print zip(split_list[:-1], split_list[1:])[32, 21, 39, 20]
[(0, 32), (32, 53), (53, 92), (92, 112)]在拿到一个binary_features的索引后即可知道该索引对应的节点使用的特征序号(float_features的索引)。
def find_feature(tree_splits_index):
    for i in range(len(split_list) - 1):
        if split_list[i] <= tree_splits_index < split_list[i+1]:
            return i
有了节点在binary_features中的索引,该索引也对应特征的判断边界数值索引,也知道了如何根据索引获取特征序号。决策树索引信息都的得到了,现在可以绘制树了。
绘制单棵决策树
首先修改一下代码,便于获取单棵树的节点
class CatBoostTree(object):

    def __init__(self, CatboostModel):
        self.model = CatboostModel
        self.split_list = [0]
        for i in range(self.model.float_feature_count):
            self.split_list.append(self.split_list[-1] + self.model.border_counts[i])

def find_feature(self, splits_index):
    # 可优化成二分查找
    for i in range(self.model.float_feature_count):
        if self.split_list[i] <= splits_index < self.split_list[i + 1]:
            return i

def get_split_index(self, tree_id):
    tree_splits_index = 0
    current_tree_leaf_values_index = 0
    for index in range(tree_id):
        current_tree_depth = self.model.tree_depth[index]
        tree_splits_index += current_tree_depth
        current_tree_leaf_values_index += (1 << current_tree_depth)
    return tree_splits_index, current_tree_leaf_values_index

def get_tree_info(self, tree_id):
    tree_splits_index, current_tree_leaf_values_index = self.get_split_index(tree_id)

    current_tree_depth = self.model.tree_depth[tree_id]
    tree_splits_list = []
    for depth in range(current_tree_depth):
        tree_splits_list.append(self.model.tree_splits[tree_splits_index + depth])

    node_feature_list = [self.find_feature(index) for index in tree_splits_list]
    node_feature_borders = [self.model.borders[index] for index in tree_splits_list]
    end_tree_leaf_values_index = current_tree_leaf_values_index + (1 << current_tree_depth)
    tree_leaf_values = self.model.leaf_values[current_tree_leaf_values_index: end_tree_leaf_values_index]
    return current_tree_depth, node_feature_list, node_feature_borders, tree_leaf_values
下面是绘制一棵决策树的函数,CatBoost导出的python代码文件通过model_file参数传入。
import imp

import os
os.environ["PATH"] += os.pathsep + 'E:/Program Files (x86)/Graphviz2.38/bin'

from graphviz import Digraph

def draw_tree(model_file, tree_id):
    fp, pathname, description = imp.find_module(model_file)
    CatboostModel = imp.load_module('CatboostModel', fp, pathname, description)
    catboost_tree = CatBoostTree(CatboostModel.CatboostModel)
    current_tree_depth, node_feature_list, node_feature_borders, tree_leaf_values = catboost_tree.get_tree_info(tree_id)
    dot = Digraph(name='tree_'+str(tree_id))
for depth in range(current_tree_depth):
    node_name = str(node_feature_list[current_tree_depth - 1 - depth])
    node_border = str(node_feature_borders[current_tree_depth - 1 - depth])
    label = 'column_' + node_name + '>' + node_border
    if depth == 0:
        dot.node(str(depth) + '_0', label)
    else:
        for j in range(1 << depth):
            dot.node(str(depth) + '_' + str(j), label)
            dot.edge(str(depth-1) + '_' + str(j//2), str(depth) + '_' + str(j), label='No' if j%2 == 0 else 'Yes')

depth = current_tree_depth
for j in range(1 << depth):
    dot.node(str(depth) + '_' + str(j), str(tree_leaf_values[j]))
    dot.edge(str(depth-1) + '_' + str(j//2), str(depth) + '_' + str(j), label='No' if j%2 == 0 else 'Yes')

# dot.format = 'png'
path = dot.render('./' + str(tree_id), cleanup=True)
print path
例如绘制第11棵树(序数从0开始)。draw_tree(‘catboost_model_file’, 11)。

为了验证这个对不对,需要对一个测试特征生成每棵树的路径和结果,抽查一两个测试用例以及其中的一两颗树,观察结果是否相同。
def test_tree(model_file, float_features):
    fp, pathname, description = imp.find_module(model_file)
    CatboostModel = imp.load_module('CatboostModel', fp, pathname, description)
    model = CatboostModel.CatboostModel
    catboost_tree = CatBoostTree(CatboostModel.CatboostModel)
    result = 0
    for tree_id in range(model.tree_count):
        current_tree_depth, node_feature_list, node_feature_borders, tree_leaf_values = catboost_tree.get_tree_info(tree_id)
        route = []
        for depth in range(current_tree_depth):
            route.append(1 if float_features[node_feature_list[depth]] > node_feature_borders[depth] else 0)

        index = 0
        for depth in range(current_tree_depth):
            index |= route[depth] << depth

        tree_value = tree_leaf_values[index]
        print route, index, tree_value
        result += tree_value
    return result
如我们生成了第11棵树的图像,根据测试测试特征,手动在图像上查找可以得到一个值A。test_tree函数会打印一系列值,其中第11行对应的结果为值B。值A与值B相同,则测试为问题。
其次还需要测试所有树的结果和导出文件中apply_catboost_model函数得到的结果相同。这个可以写个脚本,拿训练数据集跑一边。
from catboost_model_file import apply_catboost_model
from CatBoostModelInfo import test_tree

from sklearn.datasets import load_iris

def main():
    iris = load_iris()
    # print iris.data
    # print iris.target
    for feature in iris.data:
    if apply_catboost_model(feature) != test_tree('catboost_model_file', feature):
        print False
print 'End.'
if name == 'main':
    main()
至此,CatBoost模型的可视化完成了。